SAR+RSI+EMAs SignalsNOTE:
Indicator based strategies may expire and begin to work again. There are various ways to check the expiration of these strategies but I suggest equity curve trading (EC trading) as the best one.
Please check every single indicator based strategy to see if it’s still profitable or it has been expired to avoid losses.
Principles:
I personally believe every profitable indicator-based setup need 3 factors. Actually I analyze indicator-based set up in this way!
1- Trend detector: a tool that detect the “trend”.
2- Oscillators (Discount finder): a tool that detects “discounts” in the direction of the trend.
3- Stimulus: A tool that indicates the Initiation of a movement.
There may be profitable strategies that do not use all three, because other factors are strong enough to lead us to profit, but they are rare and sometimes they hide the other forgotten factor in the main two ones.
Elements:
(Since most of traders here, are familiar with these famous indicators I will not take your time to write about their uses and formula)
SAR: As a Trend detector, regarding position of close and SAR
EMA 7 and EMA 21: As trend detectors, regarding position of EMA 7 as fast “moving average” and EMA 21 as slow one. Also we need another confirmation for trend regarding EMA 7 and closing price of the signal candle.
RSI: In this strategy RSI is used both as a discount finder and a stimulus.
For RSI being over/under 50, regarding the trend, a possible discount may have been occurred. Imagine these conditions: close>EMA7, EMA7>EMA21, close>SAR and simultaneously RSI being under 50 is really a sign of powerful uptrend which it’s RSI decreasing might be a sign of corrective move, which will be following a bullish impulsive move.
The other use of RSI is to stimulate a buy signal by “crossing” over 50 or 30 (50 as balanced point of momentum and 30 as a sign of ending an oversold) or stimulate a sell signal by “crossing” under 50 or 70 (50 as balanced point of momentum and 70 as a sign of ending an overbought).
Entry point: you can use one of the followings.
1- Open of the next candle
2- EMA 7
3- Open of the signal candle
(Totally optional but “open of the next candle” is suggested by me.)
SL: Use one of the followings.
1- SAR or some pips (regarding ATR Or your experience of this trading instrument’s fluctuations in this time frame) below the SAR
2- Fixed amount (regarding ATR Or your experience of this trading instrument’s fluctuations in this time frame)
3- Use EMA21 as dynamic SL (if a candle far enough from the initiative candle close over (for sell) below ( for buy)
Again number 1 is suggested by me.
TP: Use one of the followings.
1- Use static levels or zones of support and resistance as TP.
2- Use dynamic levels for instance band of BB or moving averages (Moving the SL is possible).
3- Use fixed R to R
And I believe static zones of support and resistance work better.
Examples:
I indicate a buy signal on the chart!
Using local level as TP worked just good.
Using EMA was better in this case.
And using a riskier level or a fixed R to R is obvious in the chart!
Since in the range markets, this strategy may not work well and at the same time, TP to SL might be too small to be worth the risk, I prefer to use levels to filter range market conditions!
I convert all those circumstances to a simple buy and sell signs on the chart!
EMA21 and SAR are still visible because it is possible that traders use them for their TP and SL.
This is how it look without EMA21 and SAR!
Another screenshot of this strategy!
I also add a check box to filter signals by another trend detector. MATD created by me to help traders detect trend!
As it’s visible, some profitable signals filtered too, but using a longer-term trend detector as an additional one, alongside the double EMAs is very useful for this strategy.
The other box “use high&low instead of close for fast EMA” makes the “EMA7 and close” trend detector an easygoing one!
Almost everything is editable here!
*** I did not invent this strategy, you can find it for free on net ***
I'll change it to a "strategy" instead of an indicator if reader like to!
Cerca negli script per "3 ema"

EMA Crossover CandlesEMA Crossover Candles
This indicator colors your chart candles based on the relationship between two Exponential Moving Averages (EMAs).
How It Works
Green Candles - When the Fast EMA is above the Slow EMA, indicating bullish momentum
Red Candles - When the Fast EMA is below the Slow EMA, indicating bearish momentum
Settings
Source - The price data used for EMA calculations (default: close)
Fast Length - Period for the fast EMA (default: 5)
Slow Length - Period for the slow EMA (default: 10)
How To Use
This indicator provides a quick visual reference for trend direction. Green candles suggest the short-term trend is bullish, while red candles suggest bearish conditions. This can help you:
Identify trend direction at a glance
Filter trades in the direction of the trend
Spot potential trend changes when candle colors shift
Tips
Adjust the Fast and Slow Length settings to match your trading timeframe
Shorter periods = more responsive but more false signals
Longer periods = smoother but slower to react to trend changes
Consider hiding default candles in Chart Settings for a cleaner look
Note: This indicator is for informational purposes only and should not be used as the sole basis for trading decisions. Always use proper risk management and consider combining with other forms of analysis.
Feel free to modify this to match your style or add any additional details you'd like to include.Claude is AI and can make mistakes. Please double-check responses. Opus 4.5

EMA Cloud TrendEMA Cloud Trend (Dual-Layer)
A clean and popular two-layer EMA cloud indicator:
• Inner cloud (EMA 8 – EMA 18): Bright yellow with 80% transparency
• Outer cloud (EMA 18 – EMA 36): Green (bullish) or Red (bearish) with 70% transparency
Trend direction is determined by the position of the fast EMA (8) relative to the slow EMA (36):
- Green outer cloud → Bullish bias
- Red outer cloud → Bearish bias
Fully transparent design that doesn’t hide price action. Perfect for trend confirmation, swing trading, and as a visual background filter.
Lightweight • No repainting • Works on all markets and timeframes
Enjoy the clouds!
EMA Cloud Trend (Çift Katmanlı)

9/15 EMA Scalper 9/15 EMA Scalper — by uzairbaloch
This script is a price-action based scalping system built around the 9 EMA and 15 EMA trend structure.
It identifies short-term reversal points where the market pulls back into the EMAs and confirms direction with a strong candle signal.
The strategy looks for:
• A clear EMA trend (9 above 15 for buys, 9 below 15 for sells)
• Pullback into EMA9/EMA15 with candle bodies touching the fast EMA
• Strong confirmation candle (engulfing / strong momentum / controlled wick)
• Optional slope filter to avoid flat, choppy sessions
• Automatic trade labels showing Entry, SL and TP (based on R:R)
The script is designed for scalping on gold, indices, and high-volatility FX pairs.
It resets trade logic immediately after SL or TP is hit, so it can catch the next valid signal without delay.
This tool is meant as an indicator — not a full strategy — and can be used to visually mark high-probability EMA pullback setups with precise levels.
Author: uzairbaloch

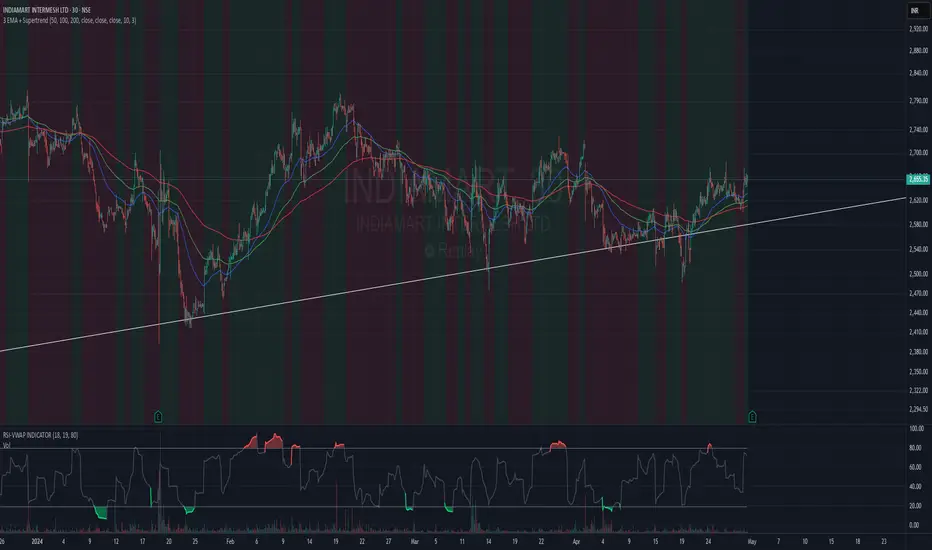
3 EMA + SupertrendThree EMAs: Helps you identify the general trend direction and potential crossovers.
When the Fast EMA crosses above the Medium or Slow EMAs, it may indicate a bullish trend, and vice versa for bearish trends.
Supertrend: Works as a trend filter. You can use it to identify overall market conditions:
When the Supertrend is green, it indicates an uptrend.
When the Supertrend is red, it indicates a downtrend.
Combination: The EMAs help you confirm the trend, and the Supertrend can act as a filter or confirmation tool for your entries and exits.
Potential Strategy Idea:
Long Entry: When the Fast EMA crosses above the Medium EMA, and the Supertrend is green.
Short Entry: When the Fast EMA crosses below the Medium EMA, and the Supertrend is red.
Exit: You can use either the Supertrend turning from green to red (for long exits) or vice versa.
Stock_Cloud-EMA,VWAP,ST Indicator_V1Stock_Cloud V1 - EMA, VWAP, SuperTrend Strategy Indicator
This indicator combines three powerful technical indicators (EMA, VWAP, and SuperTrend) to create a comprehensive trading system that helps identify high-probability trading setups when all components align.
Strategy Components & Logic:
• EMA (Exponential Moving Average): Acts as a dynamic support/resistance and trend direction indicator
• VWAP (Volume Weighted Average Price): Provides important institutional price levels and volume-based trend strength
• SuperTrend: Offers trend direction and potential reversal points
Why These Components Work Together:
1. EMA filters out market noise while maintaining responsiveness to price changes
2. VWAP adds volume-based price validation, especially useful for intraday trading
3. SuperTrend confirms trend direction and potential reversal points
4. When all three indicators align, it creates a high-probability setup
Signal Generation:
• Bullish Signal: Generated when price crosses above all three indicators (EMA, VWAP, and SuperTrend turns bullish)
• Bearish Signal: Generated when price crosses below all three indicators (EMA, VWAP, and SuperTrend turns bearish)
• Background color changes help visualize the current market condition
Settings:
- EMA Length: 20 (default, adjustable)
- SuperTrend Period: 10 (default, adjustable)
- SuperTrend Multiplier: 3.0 (default, adjustable)
How to Use:
1. Look for potential entries when all three indicators align
2. Small triangles mark key entry points when alignment occurs
3. Use background color as additional confirmation
4. Monitor price action relative to all three indicators for exit signals
Best Timeframes:
Works well on all timeframes, but particularly effective on 5-minute to daily charts for stocks and indices.
Note: This indicator combines traditional technical analysis tools in a unique way to provide clear, actionable signals. Always use proper risk management and consider other factors like market conditions and support/resistance levels.
Created by Stock_Cloud
Version 2.0

Distance between EMA 50-100/100-150This script calculates and plots the percentage difference between the 50-period, 100-period, and 150-period Exponential Moving Averages (EMA) on a TradingView chart. The aim is to provide a clear visual representation of the market's momentum by analyzing the distance between key EMAs over time.
Key features of this script:
1. EMA Calculation : The script computes the EMA values for 50, 100, and 150 periods and calculates the percentage difference between EMA 50 and 100, and between EMA 100 and 150.
2. Custom Threshold : Users can adjust a threshold percentage to highlight significant divergences between the EMAs. A default threshold is set to 0.1%.
3. Visual Alerts : When the percentage difference exceeds the threshold, a visual marker appears on the chart:
Green Circles for bullish momentum (positive divergence),
Red Circles for bearish momentum (negative divergence),
Diamonds to indicate the first occurrence of new bullish or bearish signals, allowing users to catch fresh market trends.
4. Dynamic Plotting : The script plots two lines representing the percentage difference for each EMA pair, offering a quick and intuitive way to monitor trends.
Ideal for traders looking to gauge market direction using the relationship between multiple EMAs, this script simplifies analysis by focusing on key moving average interactions.

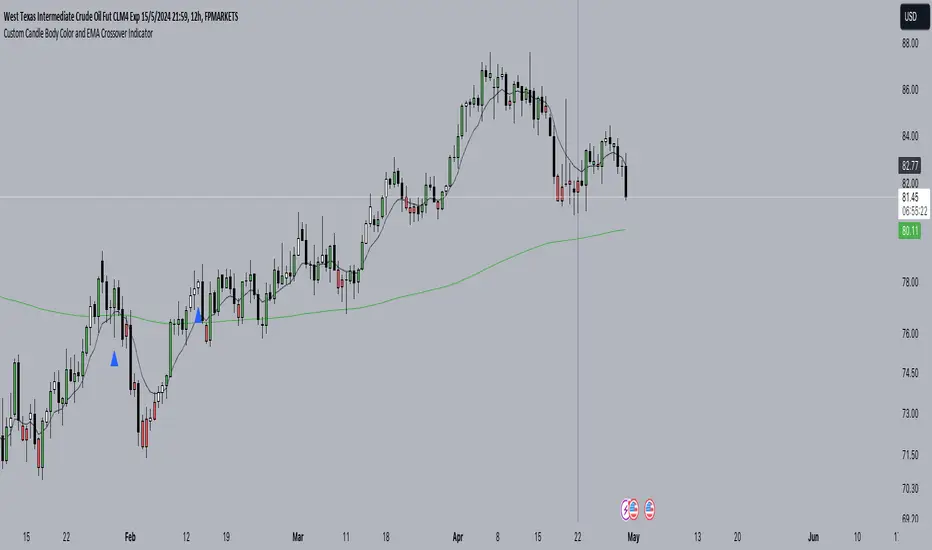
Custom Candle Body Color and EMA Crossover IndicatorWe determine if the price is below EMA 9 by comparing the close price with EMA 9.
We determine if the current candle body is huge compared to the previous candle's body.
We plot EMA 9 in black color and EMA 200 in green color.
We plot blue triangles below the bars for EMA crossover above and red triangles above the bars for EMA crossover below.
We set the color of the candle body to red if the price is below EMA 9 and to green if the price is above EMA 9, only when the current candle body is huge compared to the previous candle's body.
Buy/Sell EMA CandleThis indicator is designed to display various technical indicators, candle patterns, and trend directions on a price chart. Let's break down the code and explain its different sections:
Exponential Moving Averages (EMA):
The code calculates and plots five EMAs of different lengths (13, 21, 55, 90, and 200) on the price chart. These EMAs are used to identify trends and potential crossovers.
Engulfing Candle Patterns:
The code identifies and highlights potential bullish and bearish engulfing candle patterns. It checks if the current candle's body size is larger than the combined body sizes of the previous and subsequent four candles. If this condition is met, it marks the pattern on the chart.
s3.tradingview.com
EMA Crossovers:
The code identifies and highlights points where the shorter EMA (ema1) crosses above or below the longer EMA (ema2). It plots circles to indicate these crossover points.
Candle Direction and RSI Trend:
The code determines the trend direction of the last candle based on whether it closed higher or lower than its open price. It also calculates the RSI (Relative Strength Index) and determines its trend direction (overbought, oversold, or neutral) based on predefined thresholds.
s3.tradingview.com
Table Display:
The code creates a table displaying trend directions for different timeframes (monthly, weekly, daily, 4-hour, and 1-hour) for candle direction and RSI trends. The trends are labeled with "L" for long, "S" for short, and "N/A" for not applicable.
High Volume Bars (HVB):
The code identifies and colors bars with above-average volume as either bullish or bearish based on whether the price closed higher or lower than it opened. The color and conditions for high volume bars can be customized.
s3.tradingview.com
Doji Candle Pattern:
The code identifies and marks doji candle patterns, where the open and close prices are very close to each other within a certain percentage of the candle's high-low range.
RSI-Based Candle Coloring:
The code adjusts the color of the candles based on the RSI value. If the RSI value is above the overbought threshold or below the oversold threshold, the candles are colored yellow.
Usage and Interpretation:
Traders can use this indicator to identify potential trend changes based on EMA crossovers and candle patterns like engulfing and doji.
The RSI trend direction can provide additional insight into potential overbought or oversold conditions.
High volume bars can indicate potential price reversals or continuation patterns.
The table provides an overview of trend directions on different timeframes for both candle direction and RSI trends.
Keep in mind that this is a complex indicator with multiple features. Users should carefully evaluate its performance and consider combining it with other indicators and analysis methods for more accurate trading decisions.
The table is designed to provide a consolidated view of trend directions and other indicators across multiple timeframes. It is displayed on the chart and organized into rows and columns. Each row corresponds to a specific aspect of analysis, and each column corresponds to a different timeframe.
Here's a breakdown of the components of the table:
Row 1: Separation.
Row 2 (Header Row): This row contains the headers for the columns. The headers represent the different timeframes being analyzed, such as Monthly (M), Weekly (W), Daily (D), 4-hour (4h), and 1-hour (1h).
Row 3 (Content Row): This row contains labels indicating the types of information being displayed in the columns. The labels include "T" for Trend, "C" for Current Candle, and "R" for RSI Trend.
Row 4 and Onwards: These rows display the actual data for each aspect of analysis across different timeframes.
For each aspect of analysis (Trend, Current Candle, RSI Trend), the corresponding rows display the following information:
Monthly (M): The trend direction for the given aspect on the monthly timeframe.
Weekly (W): The trend direction for the given aspect on the weekly timeframe.
Daily (D): The trend direction for the given aspect on the daily timeframe.
4-hour (4h): The trend direction for the given aspect on the 4-hour timeframe.
1-hour (1h): The trend direction for the given aspect on the 1-hour timeframe.
The trend directions are represented by labels such as "L" for Long, "S" for Short, or "N/A" for Not Applicable.
The table's purpose is to provide a quick overview of trend directions and related information across multiple timeframes, aiding traders in making informed decisions based on the analysis of trend changes and other indicators.

Trend #4 - ATR+EMA channelOverview:
This strategy use ATR to take-profit, Red-EMA to stop-loss, Blue-EMA channel to judgment breakout.
This strategy use commission setting is 0.05%, slippage setting is 2 ticks, you can set the appropriate value size in the properties page.
What it does:
This strategy detects when a trend is emerging and buy or sell.
How it does it:
When the price breaks through the blue EMA channel, the trend is judged to be strong in the short term, strategy generates a buy or sell order.
After buying or selling,, if the price moves in the expected direction, uses ATR to determine the appropriate spread to take profit, otherwise use red EMA for stop loss.
How to use it:
Start Date and Stop Date - This parameter adjusts the time range used by the strategy.
Stoploss - This parameter adjusts the stop loss amount after each order is placed.
Blue EMA length - This parameter adjusts the length of the channel.
Blue EMA multy - This parameter adjusts the width of the top and bottom of the channel.
ATR Period - This parameter adjusts the number of candles used by the ATR.
ATR mult - This parameter adjusts the upper and lower widths of the ATR. Lowering this parameter can improve the win rate, but not necessarily the profitability.
Red EMA length - This parameter adjusts the number of candles used by the red EMA .
Long - This switch is used to turn Long position on or off.
Short - This switch is used to turn short position on or off.

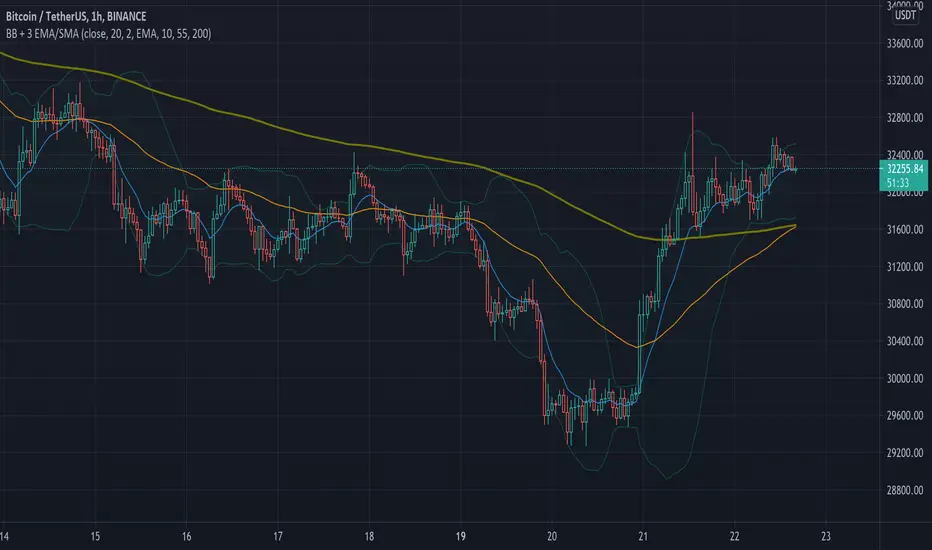
Simple Bollinger Bands + 3 EMAWe know that the number of indicators that we can use is limited, that is why with this indicator the Bollinger Bands + 3 EMAs join and be able to use 4 indicators in 1.
Bollinger Bands (BB)
Bollinger Bands (BB) are a widely popular technical analysis instrument created by John Bollinger in the early 1980’s. Bollinger Bands consist of a band of three lines which are plotted in relation to security prices. The line in the middle is usually a Simple Moving Average (SMA) set to a period of 20 days (the type of trend line and period can be changed by the trader; however a 20 day moving average is by far the most popular). The SMA then serves as a base for the Upper and Lower Bands which are used as a way to measure volatility by observing the relationship between the Bands and price. Typically the Upper and Lower Bands are set to two standard deviations away from the SMA (The Middle Line); however the number of standard deviations can also be adjusted by the trader.
Exponential Moving Average (EMA)
Moving averages visualize the average price of a financial instrument over a specified period of time. However, there are a few different types of moving averages. They typically differ in the way that different data points are weighted or given significance. An Exponential Moving Average (EMA) is very similar to (and is a type of) a weighted moving average. The major difference with the EMA is that old data points never leave the average. To clarify, old data points retain a multiplier (albeit declining to almost nothing) even if they are outside of the selected data series length.
The 3 EMAs that the Script has, are configured as follows:
Fast EMA (purple) 10 periods.
Slow EMA (blue) 55 periods.
Big EMA (olive) 200 periods.
However, you can configure each one with the color and the number of periods you want.
There are other indicators in the Public Library that have similar functions to this Script, but they all do it in a more complex and less friendly way when configuring it, for this reason we wanted to keep this Script as simple as possible.
[fikira] MTF MA/EMA'sHere is my take on MA/EMA's and MTF, based on the most excellent work of
"PineCoders" (MTF Selection Framework functions)!
The big advantage is that on 1 image you can easily see where
price is compared to different MA/EMA's (each of different Time Frames).
This gives a lot of Support and Resistance area's!
Includes:
- MA/EMA 20
- MA/EMA 50
- MA/EMA 100
- MA/EMA 200
The present Time Frame MA/EMA has a coloured circle at the side.
Each can be altered in length (the length is visible at the side and changed with the settings)
Each has an extra 4 different Time Frames (multiple settings possible)
Crossover and crossunder MA/EMA 50 with 100 (Silver Cross) and 200 (Golden Cross) is included.
The present Time Frame Cross has a "o" above the Cross
Time Frame 1 Cross has a "1" above the Cross
Time Frame 1 Cross has a "2" above the Cross
Time Frame 1 Cross has a "3" above the Cross
Time Frame 1 Cross has a "4" above the Cross

haddocks EMA Script5 exponential moving averages (EMA) in one indicator
EMA 21 black
EMA 55 blue
EMA 99 green
EMA 200 purple
EMA 300 red
EMA's are a powerfull tool to detect trends on all timeframes.
You can copy this script and modify it, if you want to use a differen selection of EMA's or colours.

Multi SMA EMA WMA HMA BB (5x8 MAs Bollinger Bands) MAX MTF - RRBMulti SMA EMA WMA HMA 4x7 Moving Averages with Bollinger Bands MAX MTF by RagingRocketBull 2019
Version 1.0
All available MAX MTF versions are listed below (They are very similar and I don't want to publish them as separate indicators):
ver 1.0: 4x7 = 28 MTF MAs + 28 Levels + 3 BB = 59 < 64
ver 2.0: 5x6 = 30 MTF MAs + 30 Levels + 3 BB = 63 < 64
ver 3.0: 3x10 = 30 MTF MAs + 30 Levels + 3 BB = 63 < 64
ver 4.0: 5(4+1)x8 = 8 CurTF MAs + 32 MTF MAs + 20 Levels + 3 BB = 63 < 64
ver 5.0: 6(5+1)x6 = 6 CurTF MAs + 30 MTF MAs + 24 Levels + 3 BB = 63 < 64
ver 6.0: 4(3+1)x10 = 10 CurTF MAs + 30 MTF MAs + 20 Levels + 3 BB = 63 < 64
Fib numbers: 8, 13, 21, 34, 55, 89, 144, 233, 377
This indicator shows multiple MAs of any type SMA EMA WMA HMA etc with BB and MTF support, can show MAs as dynamically moving levels.
There are 4 MA groups + 1 BB group, a total of 4 TFs * 7 MAs = 28 MAs. You can assign any type/timeframe combo to a group, for example:
- EMAs 9,12,26,50,100,200,400 x H1, H4, D1, W1 (4 TFs x 7 MAs x 1 type)
- EMAs 8,13,21,30,34,50,55,89,100,144,200,233,377,400 x M15, H1 (2 TFs x 14 MAs x 1 type)
- D1 EMAs and SMAs 8,13,21,30,34,50,55,89,100,144,200,233,377,400 (1 TF x 14 MAs x 2 types)
- H1 WMAs 13,21,34,55,89,144,233; H4 HMAs 9,12,26,50,100,200,400; D1 EMAs 12,26,89,144,169,233,377; W1 SMAs 9,12,26,50,100,200,400 (4 TFs x 7 MAs x 4 types)
- +1 extra MA type/timeframe for BB
There are several versions: Simple, MTF, Pro MTF, Advanced MTF, MAX MTF and Ultimate MTF. This is the MAX MTF version. The Differences are listed below. All versions have BB
- Simple: you have 2 groups of MAs that can be assigned any type (5+5)
- MTF: +2 custom Timeframes for each group (2x5 MTF) +1 TF for BB, TF XY smoothing
- Pro MTF: 4 custom Timeframes for each group (4x3 MTF), 1 TF for BB, MA levels and show max bars back options
- Advanced MTF: +4 extra MAs/group (4x7 MTF), custom Ticker/Symbols, Timeframe <>= filter, Remove Duplicates Option
- MAX MTF: +2 subtypes/group, packed to the limit with max possible MAs/TFs: 4x7, 5x6, 3x10, 4(3+1)x10, 5(4+1)x8, 6(5+1)x6
- Ultimate MTF: +individual settings for each MA, custom Ticker/Symbols
MAX MTF version tests the limits of Pinescript trying to squeeze as many MAs/TFs as possible into a single indicator.
It's basically a maxed out Advanced version with subtypes allowing for mixed types within a group (i.e. both emas and smas in a single group/TF)
Pinescript has the following limits:
- max 40 security calls (6 calls are reserved for dupe checks and smoothing, 2 are used for BB, so only 32 calls are available)
- max 64 plot outputs (BB uses 3 outputs, so only 61 plot outputs are available)
- max 50000 (50kb) size of the compiled code
Based on those limits, you can only have the following MAs/TFs combos in a single script:
1. 4x7, 5x6, 3x10 - total number of MTF MAs must always be <= 32, and you can still have BB and Num Levels = total MAs, without any compromises
2. 5(4+1)x8, 6(5+1)x6, 4(3+1)x10 - you can use the Current Symbol/Timeframe as an extra (+1) fixed TF with the same number of MTF MAs
- you don't need to call security to display MAs on the Current Symbol/Timeframe, so the total number of MTF MAs remains the same and is still <= 32
- to fit that many MAs into the max 64 plot outputs limit you need to reduce the number of levels (not every MA Group will have corresponding levels)
Features:
- 4x7 = 28 MAs of any type
- 4x MTF groups with XY step line smoothing
- +1 extra TF/type for BB MAs
- 2 MA subtypes within each group/TF
- 4x7 = 28 MA levels with adjustable group offsets, indents and shift
- supports any existing type of MA: SMA, EMA, WMA, Hull Moving Average (HMA)
- custom tickers/symbols for each group
- show max bars back option
- show/hide both groups of MAs/levels/BB and individual MAs
- timeframe filter: show only MAs/Levels with TFs <>= Current TF
- hide MAs/Levels with duplicate TFs
- support for custom TFs that are not available in free accounts: 2D, 3D etc
- support for timeframes in H: H, 2H, 4H etc
Notes:
- Uses timeframe textbox instead of input resolution dropdown to allow for 240 120 and other custom TFs
- Uses symbol textbox instead of input symbol to avoid establishing multiple dummy security connections to the current ticker - otherwise empty symbols will prevent script from running
- Possible reasons for missing MAs on a chart:
- there may not be enough bars in history to start plotting it. For example, W1 EMA200 needs at least 200 bars on a weekly chart.
- for charts with low/fractional prices i.e. 0.00002 << 0.001 (default Y smoothing step) decrease Y smoothing as needed (set Y = 0.0000001) or disable it completely (set X,Y to 0,0)
- for charts with high price values i.e. 20000 >> 0.001 increase Y smoothing as needed (set Y = 10-20). Higher values exceeding MAs point density will cause it to disappear as there will be no points to plot. Different TFs may require diff adjustments
- TradingView Replay Mode UI and Pinescript security calls are limited to TFs >= D (D,2D,W,MN...) for free accounts
- attempting to plot any TF < D1 in Replay Mode will only result in straight lines, but all TFs will work properly in history and real-time modes. This is not a bug.
- Max Bars Back (num_bars) is limited to 5000 for free accounts (10000 for paid), will show error when exceeded. To plot on all available history set to 0 (default)
- Slow load/redraw times. This indicator becomes slower, its UI less responsive when:
- Pinescript Node.js graphics library is too slow and inefficient at plotting bars/objects in a browser window. Code optimization doesn't help much - the graphics engine is the main reason for general slowness.
- the chart has a long history (10000+ bars) in a browser's cache (you have scrolled back a couple of screens in a max zoom mode).
- Reload the page/Load a fresh chart and then apply the indicator or
- Switch to another Timeframe (old TF history will still remain in cache and that TF will be slow)
- in max possible zoom mode around 4500 bars can fit on 1 screen - this also slows down responsiveness. Reset Zoom level
- initial load and redraw times after a param change in UI also depend on TF. For example: D1/W1 - 2 sec, H1/H4 - 5-6 sec, M30 - 10 sec, M15/M5 - 4 sec, M1 - 5 sec. M30 usually has the longest history (up to 16000 bars) and W1 - the shortest (1000 bars).
- when indicator uses more MAs (plots) and timeframes it will redraw slower. Seems that up to 5 Timeframes is acceptable, but 6+ Timeframes can become very slow.
- show_last=last_bars plot limit doesn't affect load/redraw times, so it was removed from MA plot
- Max Bars Back (num_bars) default/custom set UI value doesn't seem to affect load/redraw times
- In max zoom mode all dynamic levels disappear (they behave like text)
- Dupe check includes symbol: symbol, tf, both subtypes - all must match for a duplicate group
- For the dupe check to work correctly a custom symbol must always include an exchange prefix. BB is not checked for dupes
Good Luck! Feel free to learn from/reuse the code to build your own indicators.

Price Action Signals Filtered +EMA🚀 Price Action Signals Filtered + EMA (Dual Confirmation)
💡 Indicator Overview
This indicator is a powerful tool designed to identify potential trend reversals or continuations using Price Action Pivot signals, but it filters them with an Exponential Moving Average (EMA) to ensure dual confirmation.
The indicator's purpose is to generate signals only when a Price Action confirmation aligns with a confirmed market trend (above or below the EMA), thereby reducing noise and increasing signal reliability.
✨ Key Features and Logic
1. Price Action (Pivot) Detection
The indicator automatically detects local low (Pivot Low) and local high (Pivot High) points.
Pivot Low: A potential market bottom.
Pivot High: A potential market top.
2. Price Action Confirmation
After a Pivot is detected, the indicator waits for subsequent confirmation from the closing prices of the candles:
Bullish Confirmation: After a Pivot Low, the indicator requires N consecutive candles (where N is defined in the settings) to close above the previous candle's close. This indicates buying pressure.
**Bearish Confirmation: After a Pivot High, the indicator requires N consecutive candles to close below the previous candle's close. This indicates selling pressure.
3. Trend Filter (EMA) - Dual Confirmation! 🎯
This is the critical component. A confirmed Price Action signal must align with the trend defined by the Exponential Moving Average (EMA):
Bullish Signal (Buy): Generated ONLY if the Bullish Price Action Confirmation occurs while the price (Close) is ABOVE the EMA (default 20 periods).
Bearish Signal (Sell): Generated ONLY if the Bearish Price Action Confirmation occurs while the price (Close) is BELOW the EMA.
This serves as a dual confirmation, ensuring the signal is captured in the direction of the broader market trend.
📈 How to Use
Look for the Signal: Wait for the shape (triangle, circle, or arrow) to appear on the chart.
Verify Confirmation: Know that the signal has already passed through the dual filter: Price Action and EMA.
Bullish signals appear below the bar when the price is ABOVE the EMA.
Bearish signals appear above the bar when the price is BELOW the EMA.
Risk Management: Always use this indicator in combination with your risk management strategy and technical analysis.
📝 Additional Notes
The indicator uses barstate.isconfirmed to accurately plot signals on the candle close.
The EMA line is also plotted on the chart for visual trend verification.
This indicator is a tool only and does not constitute financial advice. Always perform your own analysis and research.

Multi EMA (up to 6) - JamilThis indicator plots six customizable Exponential Moving Averages (EMA 1 to EMA 6) designed to help traders quickly identify market direction, trend strength, and dynamic support/resistance levels.
🔹 Key Features
Plots six EMAs simultaneously for multi-timeframe trend clarity
Helps detect trend reversals, pullbacks, and continuation setups
Ideal for scalping, intraday, swing trading, and funded challenges
Works on all markets (Gold, Forex, Crypto, Indices)
Customizable lengths and colors
Clean and lightweight — doesn’t affect chart performance
🔹 How to Use
When all EMAs are aligned and fanning out → Strong Trend
EMA compression → Low volatility / possible breakout setup
Price above all EMAs → Bullish zone
Price below all EMAs → Bearish zone
Perfect for traders who want a simple yet powerful trend-reading tool.

MTF EMA Directional Bias -1hr and 4hr A compact, fixed-position table (bottom-right corner) that shows the current slope direction of two higher-timeframe EMAs:
4H EMA 50 → direction over the last 2 bars (UP ↑, DOWN ↓, or FLAT ⏸)
1H EMA 21 → direction over the last 2 bars (UP ↑, DOWN ↓, or FLAT ⏸)
Background color logic:
Green → both 4H and 1H EMAs are sloping upward
Red → both 4H and 1H EMAs are sloping downward
Gray → mixed or flat directions (no confluence)
Additionally draws the actual 1H EMA-21 (purple) and 4H EMA-50 (red) as step-lines on the chart.

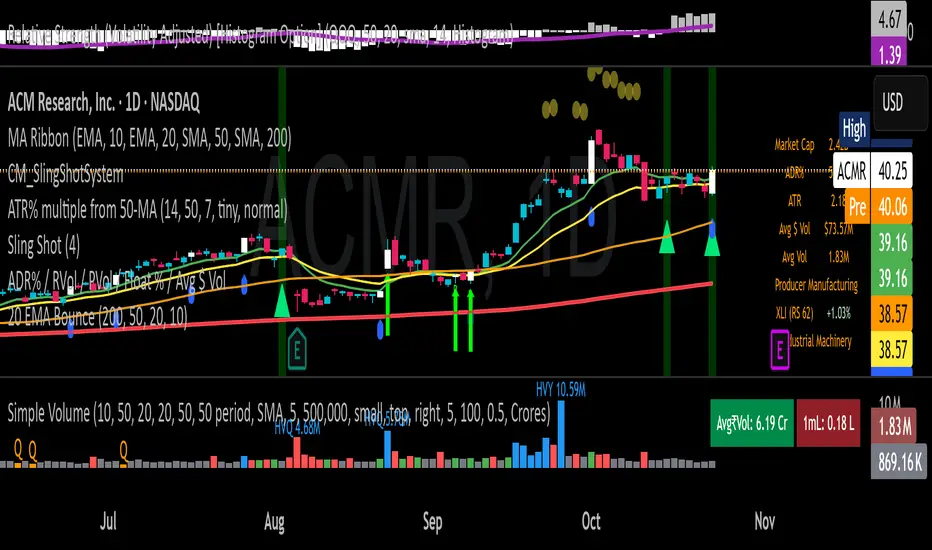
20 EMA Undercut Bounce - M4v3r1ck💎 The "EMA Undercut Bounce" Bullish Scanner
This indicator is designed to identify high-conviction continuation patterns where price makes a temporary dip for liquidity before resuming a powerful, established uptrend. It specifically looks for a bullish rejection off the 20-period Exponential Moving Average (EMA).
🎯 Strategy Logic
The signal is generated only on the Daily (1D) timeframe when the following five precise conditions are met on the most recent completed bar:
1. Price Action (The Undercut Bounce)
• Undercut: The bar's low price must have touched or temporarily traded below the 20-Day EMA.
• Rejection: The bar's close price must have fully recovered and closed above the 20-Day EMA. This is the classic sign of strong buying pressure defending a key support level.
2. Strong Trend Hierarchy (The Bullish Stack)
The moving averages must be perfectly stacked, confirming a robust multi-timeframe uptrend structure:
• 10-Day EMA > 20-Day EMA
• 20-Day EMA > 50-Day SMA
• 50-Day SMA > 200-Day SMA
3. Momentum Confirmation (The Upward Slope)
Both the 10-Day EMA and the 20-Day EMA must be rising from the previous day. This ensures that the short-term trend momentum is positive, ruling out signals during flat or turning markets.
💡 How to Use This Indicator
1. Timeframe: Ensure your chart is set to the Daily (1D) timeframe for accurate results.
2. Signal: A Green Background highlight and an Up-Arrow below the bar mark a confirmed signal.
3. Alerts: Use the built-in alert condition to set up notifications for stocks on your watchlist, allowing you to catch these high-quality setups without constantly monitoring charts.
This script is ideal for trend-following traders looking to enter a position after a healthy shakeout and confirmation of continued bullish commitment.
EMA 8/20/50 ema 8/20/50 ema 8/20/50 ema 8/20/50 ema 8/20/50 ema 8/20/50 ema 8/20/50 ema 8/20/50 ema 8/20/50

Sharpshooter 30 – EMA DistanceSharpshooter 30 – EMA Distance Pullback Detector
This indicator is designed for disciplined traders who prefer to wait for deep pullbacks
after a clear trend shift. Following a 7/200 EMA death cross, the script “arms” and waits
for the Fast EMA to move a configurable USD distance below the Slow EMA.
When this distance threshold is reached and confirmed by a closed bar,
the script plots a single BUY signal — signaling a potential rebound entry point.
Recommended timeframe: 5-minute chart (XAU/USD works best)
Key features:
• Adjustable EMA lengths
• Adjustable USD distance threshold
• One-time signal logic to avoid overplotting
Philosophy:
"Always wait" — patience defines precision. The method aims to catch
the first high-probability retracement after trend exhaustion.
日本語説明:
Sharpshooter 30は、トレンド転換後の押し目を狙うトレーダー向けのインジケーターです。
7/200 EMAのデッドクロス後、Fast EMAがSlow EMAより一定金額(例:30ドル)下回った確定足でBUYを1度だけ点灯します。
ルールを守り、焦らず待つことを目的としています。
推奨時間軸:5分足(特にXAU/USDで効果的)
MA期間や乖離幅は調整可能。

Supertrend EMA Vol Strategy V5### Supertrend EMA Strategy V5
**Overview**
This is a trend-following strategy designed for cryptocurrency markets like BTC/USD on daily timeframes, combining the Supertrend indicator for dynamic trailing stops with an EMA filter for trend confirmation. It aims to capture strong uptrends while avoiding counter-trend trades, with optional volume filtering for high-conviction entries and ATR-based stop-loss to manage risk. Ideal for long-only setups in bullish assets, it visually highlights trends with green/red bands and fills for easy interpretation. Backtested on BTC from 2024-2025, it shows potential for outperforming buy-and-hold in trending markets, but always use with proper risk management—past performance isn't indicative of future results.
**Key Features**
- **Supertrend Core**: Uses ATR to plot adaptive uptrend (green) and downtrend (red) lines, flipping on closes beyond prior bands for buy/sell signals.
- **EMA Trend Filter**: Entries require price above the EMA (default 21-period) for longs, ensuring alignment with the broader trend.
- **Volume Confirmation**: Optional filter only allows entries when volume exceeds its EMA (default 20-period), reducing false signals in low-activity periods.
- **Risk Controls**: Built-in ATR-multiplier stop-loss (default 2x) to cap losses; exits on Supertrend flips for trailing profits.
- **Visuals**: Green/red lines and highlighter fills for up/down trends, plus buy/sell labels and circles for signals.
- **Customizable Inputs**: Tweak ATR period (default 10), multiplier (default 3), EMA length, start date, long/short toggles, SL, and volume filter.
- **Alerts**: Built-in for buy/sell and direction changes.
**How to Use**
1. Add to your TradingView chart (e.g., BTC/USD 1D).
2. Adjust inputs: Start with defaults for trend-following; increase multiplier for fewer trades/higher win rate. Enable volume filter for volatile assets.
3. Monitor signals: Green "Buy" for long entries (if close > EMA and conditions met); red "Sell" for exits.
4. Backtest in Strategy Tester: Focus on equity curve, win rate (~50-60% in tests), and drawdown (<15% with SL).
5. Live Trading: Use small position sizes (1-2% risk per trade); combine with your analysis. Shorts disabled by default for bull-biased markets.

Crypto EMA TableCrypto EMA Trend Scanner
A powerful tool for crypto traders to quickly identify trend strength across multiple timeframes
This indicator helps you spot potential trading opportunities by analyzing the EMA (Exponential Moving Average) alignment across four different timeframes. It displays a clean, color-coded table showing which cryptocurrencies are in a strong uptrend.
Key Features:
Multi-Timeframe Analysis: Simultaneously scan 3-minute, 15-minute, 1-hour, and 4-hour charts
Clear Visual Signals: Green cells indicate bullish EMA alignment (EMA 20 > EMA 50 > EMA 200)
Customizable Symbols: Track up to 3 different cryptocurrencies of your choice
Exchange Selection: Compatible with major exchanges (Bybit, Binance, Coinbase, Kraken, KuCoin, FTX)
Flexible Positioning: Place the table anywhere on your chart
How to Use:
Add the indicator to your chart
Select your preferred cryptocurrencies in the settings
Position the table where you want it
Look for green cells indicating EMA lineup.
Use this information to identify potential entry points or confirm your trading bias

Ehlers Reverse EMAOverview
The Ehlers Reverse EMA is an advanced momentum indicator designed by John Ehlers and implemented here with additional features for improved trading decision-making. This indicator helps identify trend direction, potential reversals, and generates precise buy/sell signals based on multiple confirmation methods.
What Makes It Unique
Unlike conventional EMAs, the Ehlers Reverse EMA uses a sophisticated reverse-engineering approach to provide smoother, more responsive signals with reduced lag. The indicator combines a proprietary EMA calculation with optional moving average confirmation to filter out market noise and highlight meaningful price movements.
Features
Dynamic Color Coding: Green when momentum is positive, red when negative
Moving Average Overlay: Optional MA with selectable types (SMA, EMA, WMA, VWMA)
Multiple Signal Generation Methods:
Zero-Line Crossovers: Signals when momentum shifts from positive to negative or vice versa
MA Crossovers: Signals when the Ehlers EMA crosses its own moving average
Combined Confirmation: Requires both zero-line and MA crossovers for highest probability signals
On-Chart Signal Visualization: Clear buy/sell arrows directly on the price chart
Customizable Parameters: Adjust alpha value, MA type, and signal generation to suit your trading style
How To Use
Add the main "Ehlers Reverse EMA" indicator to your chart
Add the companion "EREMA Signals" indicator to display buy/sell signals on the price chart
Ensure both indicators have matching settings for consistency
Signal Interpretation
Buy Signals (Green Triangles): Appear below price bars when conditions are met
Sell Signals (Red Triangles): Appear above price bars when conditions are met
Recommended Timeframes
Works well on all timeframes from 5-minute to daily charts. For swing trading, 4H or daily timeframes often provide the most reliable signals.
Strategy Applications
Trend Following: Use zero-line crossovers to enter with the trend
Momentum Trading: Use MA crossovers for entry and exit points
Confirmation Tool: Combine with price action or other indicators for higher-probability trades
Divergence Analysis: Compare indicator movement with price action to spot potential reversals
Parameter Settings
Alpha (Default: 0.1): Lower values create smoother lines but more lag; higher values increase responsiveness but may increase false signals
MA Length (Default: 14): Adjust based on your trading timeframe and style
This versatile indicator helps identify high-probability trading opportunities while filtering out market noise, making it valuable for both novice and experienced traders alike.
